What do all the financial metrics in the proposal mean? And how did we calculate them?
We are extremely proud of our proposal and the information we provide. Our goal was simple, ensure we create a proposal that is easy to understand yet detailed enough to create transparency and trust. Solar provides so much benefit from improving the environment in which we live while also creating financial stability and predictability by locking in a homeowner’s electricity rate for 25 years and beyond. It is important to understand how we got to the numbers in your proposal which is why we have written this article. All of our calculations, featured figures, and descriptions are below. We strive to be the most transparent Residential Solar Company in the industry and hope our actions inspire others in the industry to do the same. Please reach out to us if you have any questions or comments.
Technical Metrics
Featured Figure
Description
Annual Electricity Drawn from Grid
Total kWh of electricity imported from the grid.
Annual Electricity Usage
Total kWh usage.
Annual Solar Generation (Year 1)
Total kWh solar generation in the first year of the system’s operation.
Battery Size
Aggregated kWh storage capacity of all batteries designed for that system.
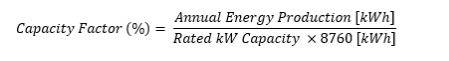
Capacity Factor (%)
The ratio between actual kWh generation divided by the maximum possible energy output for that system’s nameplate capacity in 1 year. Given by:
The capacity factor roughly ranges between 10 – 25% depending on location and system design.
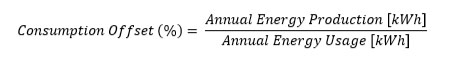
Consumption Offset (%)
The total kWh generation divided by the annual electricity usage.
Daily Solar Generation (Year 1)
The average daily solar generation in the first year of the system’s operation.
Energy From Solar (%)
The total kWh generation divided by the annual electricity usage.
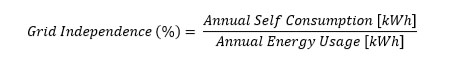
Grid Independence (%)
Percentage of a project’s annual usage that is covered entirely by solar generation. Given by:
PV System Size
Rated kW Capacity of the PV system.
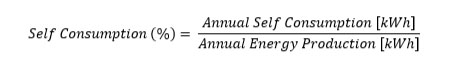
Self Consumption (%)
Percentage of energy produced by the solar system that is self-consumed, or used directed by the load.
System Lifetime
The system lifetime of the designed system.
Utility Bill & Savings
Featured Figure
Description
Annual Energy Cost After Solar
Total energy cost in the first year after installing solar. This includes the utility bill cost plus any payment amounts from loans, leases, regular payments or PPAs
First Year Savings
The savings in energy cost if the customer was to install the system designed in the first year. This is given by the old electricity bill minus the new electricity bill plus any payment amounts.
Utility Savings Per Bill
Estimated savings per electricity bill received in the first year of installing the system.
Utility Savings (Lifetime)
The estimated lifetime electricity bill savings.
Utility Savings (Year 1)
The estimated electricity bill savings in the first year of installing the system.
Utility Bill Year 1 (After Solar)
The estimated electricity bill in the first year of installing the system.
Utility Bill Year 1 (Before Solar)
The estimated electricity bill if the system was not installed.
Lifetime Utility Bill (After Solar)
The estimated total electricity bill paid if the system was installed over its lifetime.
Lifetime Utility Bill (Before Solar)
The estimated total electricity bill paid if the system was not installed over its lifetime.
Financial Metrics
Featured Figure
Description
Payback
Simple payback period. It refers to the time it takes to recover the cost of an investment.
Discount Payback Period
The time it takes to recover the cost of an investment, taking into account the time value of money as defined by the discount rate.
The discount rate can be set in Control > Design & Hardware > Setbacks & Design Settings > Simulation Settings.
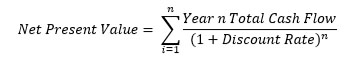
Net Present Value
The value of all future cash flows over the system lifetime.
The discount rate can be set in Control > Design & Hardware > Setbacks & Design Settings > Simulation Settings.
Total Return on Investment
The ratio of profit or loss over the system lifetime with the initial investment of purchasing that system, expressed as a percentage. Also known as the rate of return (RoR).
Rate of Return on Investment
Also known as the internal rate of return, is a discount rate that makes the net present value of all cash flows from a project equal to zero.
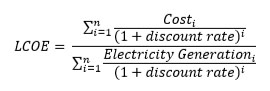
Levelized Cost of Energy
The levelized cost of energy (LCOE) is the average avoided cost per kWh of electricity produced by the system.
The discount rate can be set in Control > Design & Hardware > Setbacks & Design Settings > Simulation Settings.
Net Savings (Lifetime)
Lifetime net savings. This value can be negative if cost is greater than savings.
Pricing & Payments
Featured Figure
Description
Total System Price
The total system price is the price to the customer before applying any upfront incentives.
Purchase Price
The purchase price is the principal price the customer has to pay for the system. It is given by:
Payment Amount
It shows the payment amount for each period as defined by loans, leases and regular payments.
For cash payments, it is the same as the Purchase Price, or upfront amount the customer has to pay.
For PPAs, it shows the $/kWh cost of electricity as agreed upon on the PPA.
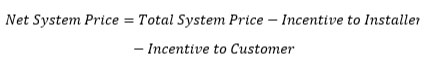
Net System Price
The net system price is the cost to the customer after accounting for all incentives. This includes any direct customer incentives received after installing the system.
Net Payment Amount
It shows the payment amount for each period as defined by loans, leases and regular payments.
For cash payments, it is the same as the Net System Price, or the cost to the customer after accounting for all incentives.
For PPAs, it shows the $/kWh cost of electricity as agreed upon in the PPA.
Net Cost
It is the same as Net Payment Amount inc tax.
The only difference is that the featured figure text for cash payment options is “Net Cost of this solar system” instead of “Net System Price including tax”.
TSP Norfolk
3719 E. Virginia Beach Blvd.
Norfolk, VA 23502
TSP Raleigh
150 Dominion Dr.
Morrisville, NC 27560
TSP Charlotte
1201 Carrier Dr.
Charlotte, NC 28216
TSP Greenville
3130 River Rd.
Piedmont, SC 29673
TSP Charleston
5081 Coosaw Creek North
Charleston, SC 29420
TSP Grayson
2255 Loganville Hwy., Suite A.
Grayson, GA 30017